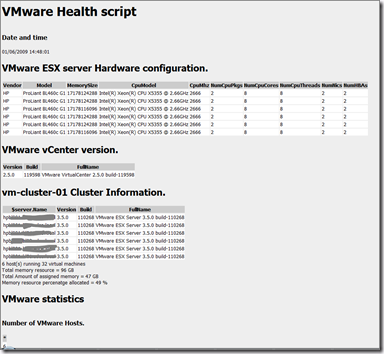
Version 2.0 of the Healthcheck script is released. The script reports the following:
– VMware ESX server Hardware and version
– VMware vCenter version
– Cluster information (Updated)
– VMware statistics (New)
– Active Snapshots
– CDROMs connected to VMs
– Floppy drives connected to VMs
– Datastores Information such as free space
– RDM information (New)
– VM information such as VMware tools version, processor and memory limits
– VM’s and there datastore (New)
– VMware timesync enabled
– Percentage disk space used inside the VM (New)
– VC error logs last 5 days (New)
It is possible to schedule this script and output the content to HTML and e-mail it.
I uses some of enhancements from the VI Toolkit forum @
http://communities.vmware.com/community/developer/windows_toolkit
If you have suggestions , let me know!
You can download the script here.
[ad#verticaal]
Hi
I really like this script, but the HTML it generates is terribly messy. All that needs doing to fix it is to output to a single object, then run that through ConvertTo-Html once, at the end. Otherwise you get multiple DOCTYPE definitions, headers etc which isn’t good and breaks the formatting in some browsers – also the generated file is much larger than it needs to be. I keep meaning to fix it myself when I get time… but something more important keeps coming up :p
@Ross, Thanks for mention, do you have an example?
@Duncan, Oeps i forgot, now i added (New) or (Changed) to the end
This script looks good. I will try this later today.
Thanks for sharing!
Great script.
How does the script know how to login to my VirtualCenter server?
I’ve installed the Toolkit on another server than the VC server and have a dedicated script/batch user.
I’ve added a username and password variable and added them to the Connect-VIServer line.
Is there any way to encrypt the password?
Ivo,
I would like some more info in the Percentage freespace on partitions… section.
Like Total disk size and total free space.
Perhaps a sorting parameter to define alternative sorting. I like sorting on VM name better…
Dear Ivo,
you script really rocks! Keep up the good work. Thanks a lot for this one!
Regards, Michael
Dear Ivo,
after I checked the new version of your awesome script, I have some ideas for improvement. The Cluster section could use some checks for common misconfiguration problems:
– Check for uppercase letters in hosts file
– Compare hosts file on ESX servers in a cluster (they should all be the same)
– Compare ESX configurations in a cluster (e.g. Datastores & Portgroups via the “Compare-Objects”-Function)
What do you think of this?
Regards, Michael
Hi ,
I can see you have used most of my additions. nice !!! From a buisness point of view this is the mother of all vmware reports.
http://communities.vmware.com/thread/184423;jsessionid=4CEF4C575F73BBE98EE67AEC5A4D11B0?tstart=0
I have also added a new column to give the size of the RDMs in the RDM information section
Also I have put in a daily and weekly report for the memory and cpu used in the vmware section
http://communities.vmware.com/thread/184423;jsessionid=4CEF4C575F73BBE98EE67AEC5A4D11B0?tstart=0
Great script! Thanks!!!
@Ross
My (highly) modified version of this script contains some code to make each of the tables sortable by clicking on the column heading.
ie, with each pipe after convert-to-html … | foreach {$_ -replace “<table”,”<table class=’sortable'”} | out-file …
And then place the sorttable.js script in the same as the output directory and voila .. every table is now sortable.
You can get this script form here:
http://www.kryogenix.org/code/browser/sorttable/
SP
OOps, I posted this on the original version, anyway. Very very nice, great work! I suggest the following enhancement to see the size of each windows disk in a VM, space used, space free and percent free (not just percfree). I however did not sort by percent free as it’s sorted by VM, up to you! I used some new variables which are also listed.
##################################################
# Percentage freespace on partitions in the VM #
##################################################
$hdCapacity = @{ N = “Capacity (GB)”; E = { % { $_.Capacity / 1000000000 } } }
$hdFreeSpace = @{ N = “FreeSpace (GB)”; E = { % { $_.FreeSpace / 1000000000 } } }
$hdSpaceUsed = @{ N=”Used (GB)”; E={ ( $_.Capacity – $_.FreeSpace ) / 1000000000 } }
$hdPercFree = @{ N=”PercFree”; E={ [math]::Round( ( 100 * ( $_.FreeSpace / $_.Capacity ) ),0 ) } }
Get-VM | Where { $_.PowerState -eq “PoweredOn”} | Get-VMGuest | Select VmName -ExpandProperty Disks | Select VmName, Path, $hdCapacity, $hdSpaceUsed, $hdFreeSpace, $hdPercFree | ConvertTo-Html –title ” Percentage freespace partitions inside the VM” –body ” Percentage freespace on partitions inside the VM.” -head “” | Out-File -Append $filelocation
I have been looking for the information regarding windows vmdk disk info (i.e., space used space free and percentage free), that is provied above in Dave’s post to be included in the updated Heathcheck script and unfortunetly am not at the level of scripting as most on here are. I am confused as to how you would incorporate the above code in as an addition to the existing Healthcheck script? Any help would be Sincerely appreciated and thanks in advance.
“there datastore” should be “their datastore”
Hi Ivo,
Really like your script. Thanks a lot for your hard work. I have a newbie question, how do I get the name of the Vmware host in the first section with the hardware details? I’ve been trying, but can’t figure it out.
Sure would appreciate your help on that.
Thanks again for all you do.
Mike,
To get the hostname with the hardware details, I have modified the code to read as follows:
$report = @()
Get-View -ViewType HostSystem | % {
$row = “” | select “Host Name”, Vendor, Model, “Memory (GB)” , “CPU Type”, “CPU Speed (MHz)”, “No. CPU(s)”, “No. Cores”, “CPU Threads”, “No. NIC(s)”, “No. HBA(s)”
$row.”Host Name” = $_.name
$row.Vendor = $_.Summary.Hardware.vendor
$row.Model = $_.Summary.Hardware.model
$ROW.”Memory (GB)” = “{0:F0}” -f ($_.Summary.Hardware.MemorySize/1GB)
$row.”CPU Type” = $_.Summary.Hardware.CpuModel
$row.”CPU Speed (MHz)” = $_.Summary.Hardware.CPUMhz
$row.”No. CPU(s)” = $_.Summary.Hardware.NumCpuPkgs
$row.”No. Cores” = $_.Summary.Hardware.NumCpuCores
$row.”CPU Threads” = $_.Summary.Hardware.NumCpuThreads
$row.”No. NIC(s)” = $_.Summary.Hardware.NumNics
$row.”No. HBA(s)” = $_.Summary.Hardware.NumHBAs
$report += $row
}
$report | ConvertTo-Html –body “ESX server Hardware” | Out-File -Append $filelocation
I’ve modifed the summary information, to read as a list rather than trying to format each seperate field in a table, here is the code I have used:
$totalnohosts = (get-vmhost | sort name -descending | % {$server = $_ | get-view; $server.config.product | select { $server.name}, version } | measure-object).count
$TotalDatastores = (get-datastore | sort name -descending | % {$server = $_ | get-view; $server.summary } | select name | measure-object).count
$TotalnoVMs = (Get-VM | sort name -descending | % {$server = $_ | get-view; $server.config.name} | select name |measure-object).count
$TotalClusters = (Get-cluster | sort name -descending | % {$server = $_ | get-view; $server.config.name} | select name |measure-object).count
$TotalDatacenters = (get-datacenter | sort name -descending | % {$server = $_ | get-view; $server.name} | select name | measure-object).count
$TotalTemplates = (get-template | sort name -descending | % {$server = $_ | get-view; $server.name} | select name | measure-object).count
$TotalCustom = (get-OSCustomizationSpec | measure-object).count
ConvertTo-Html –body “VMware Summary Information” -head “” | Out-File -append $filelocation
ConvertTo-Html –body ” Total Number of Datacenters: $TotalDataCenters” | Out-File -Append $filelocation
ConvertTo-Html –body “Total Number of Clusters: $TotalClusters” | Out-File -Append $filelocation
ConvertTo-Html –body “Number of Host Servers: $totalnohosts ” | Out-File -Append $filelocation
ConvertTo-Html –body “Number of Datastores: $TotalDatastores” | Out-File -Append $filelocation
ConvertTo-Html –body “Total Number of Virtual Machines: $TotalnoVMs” | Out-File -Append $filelocation
ConvertTo-Html –body “Total Number of VM Templates: $TotalTemplates” | Out-File -Append $filelocation
ConvertTo-Html –body “Total Number of Customizations: $TotalCustom ” | Out-File -Append $filelocation
I have updated your script. You can find it here:
http://communities.vmware.com/message/1335892#1335892
Thanks,
Jason
Dear All,
I am working in a college, we have one printer server connected with mulltiple printers.
Is there any script to find that, how many pages has been printed by the user of same domain? and to controle them.
an early respnce will be appreciated.
Thanks,
Shahnawaz
would you please have the latest script in place?